STA457 Time series analysis assignment (Fall 2018)
Statistical properties of (moving-average) rule returns
Date: 23 October 2018

Technical indicator is widely used to generate trading signals by practitioners to make trading decisions. The usual rule is to trade with the trend. In this case, the trader initiates a position early in the trend and maintains that position as long as the trend continues.
In this assignment, you are asked to study the statistical properties of returns for applying the oldest and most widely used method in technical indicators—moving averages.1
The structure of this paper is given as follows. Section 2 defines the trading rule (or strategy). In Section 3 and 4, we formulate the trading return based on a given trading rule and state the corresponding statistical properties, respectively. The questions for you to answer are listed in Section 5. Finally, references and appendix are given in Section 6 and 7, respectively.
![]()
Suppose that at each time

1 The simplest rule of this family is the single moving average which says when the rate penetrates from below (above) a moving average of a given length, a buy (sell) signal is generated.
The above predictor is then converted to buy and sell trading signals Bt: buy (+1) and sell (-1) using, i.e.

Note that the signal of a trading rule is completely defined by one of the inequalities giving a sell or buy order (if the position is not short, it is long).
For example, consider a trading rule based on the moving average of order five rule (

In this case, we buy the asset (Bt

and sell the asset (Bt

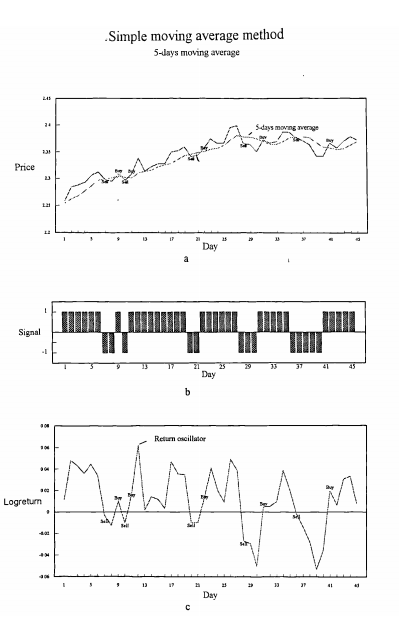
The Figure below illustrates the dynamics of the above 5-periods moving average method— when the rate penetrates from below (above) the moving average of order five, a buy (sell) signal is generated.
For your assignment, we consider Ft

where 
 = 0.
= 0.

For the period
![]()
![]()

where 
Remark: Rt
Remark: We may define the realized returns as

where

![]()
Under the assumption that Bt follows a stationary Gaussian process, several statistical properties of rule returns can be derived:
1. Unconditional expected return:

(2)
2. Unconditional variance:

Additionally,
Kedem (1986) shows that the expected zero crossing rate for a
stationary process as the expected zero-crossing rate for a
discrete-time, zero-mean, stationary Gaussian sequence Zt

where

2 Intuitively, the longer holding period, the larger the expected return on a trading rule.
![]()
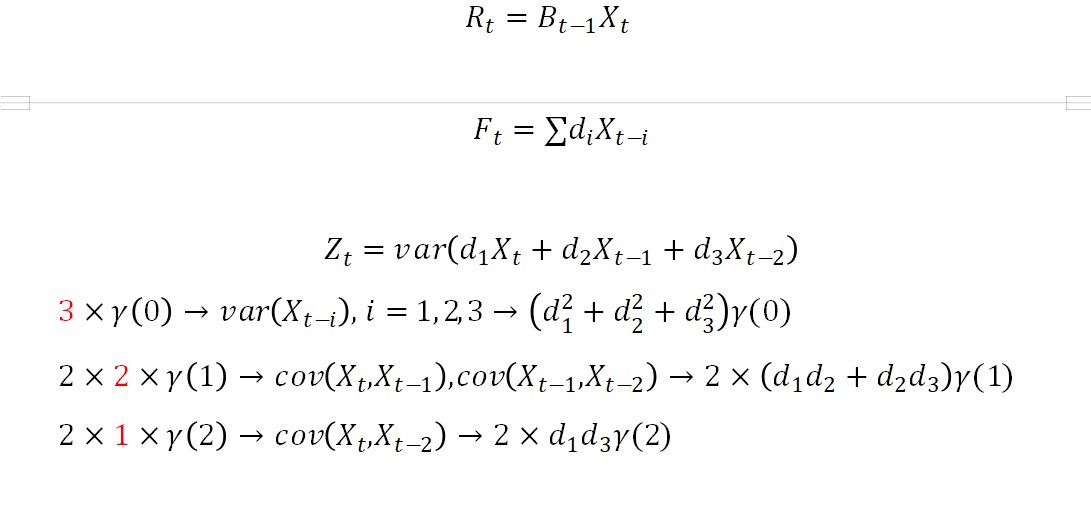
1. Derive the variance of the predictor Bt given in Equation (1).

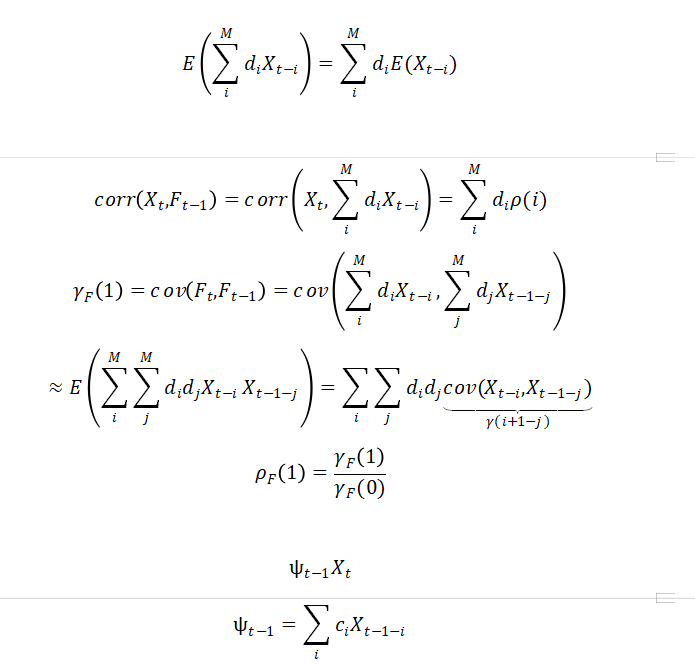
2. Derive the expectation of the predictor Bt
![]()

3. Derive the autocorrelation function at lag one for the predictor. Hint: 
4. Write a R function to calculate the expectation of the rule return for a given double MA
trading rule (See Appendix) and the expected length of the holding period.
![]() Hint: Given asset price time series and a pair of integers, m
Hint: Given asset price time series and a pair of integers, m
5. Use a R function to download daily, weekly S&P500 index from Oct/01/2009 to
Sep/30/2018 from yahoo finance
Hint: adjusted Close and
6. ![]() Write a R function to choose the optimal daily and weekly double MA trading rules (that maximize the expected rule returns) for S&P500 index.
Write a R function to choose the optimal daily and weekly double MA trading rules (that maximize the expected rule returns) for S&P500 index.
Hint: Find the
7. Write a R function to calculate the in-sample trading statistics (cumulative return and
holding time) of your choice and compare them with your theoretical results.
![]() Hint: Use the ratio of the cumulative return over the number of trading periods as the estimate
Hint: Use the ratio of the cumulative return over the number of trading periods as the estimate
8. (Optional) Run and back-test your daily trading rule using six months of rolling window. Show the empirical trading statistics and show the difference between the theoretical results.
![]()
1. Acar, E. (1993). Economic evaluation of financial forecasting. (Unpublished Doctoral thesis, City University London.)
2. Acar E. (200?), “Advanced trading rule”, Second edition. (Chapter 4. Expected returns of directional forecasters).
3. Kedem (1986), “Spectral analysis and discrimination by zero-crossings”, Proceedings of IEEE, Vol 74, No. 11, page 1477-1493.
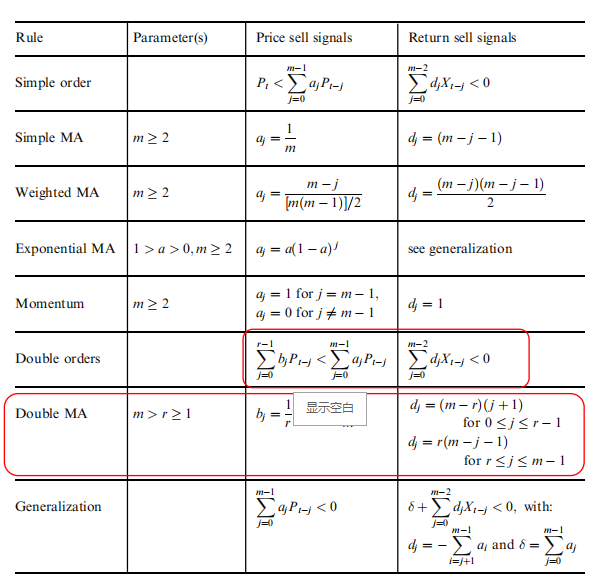
Table 1: Return/Price signals equivalence
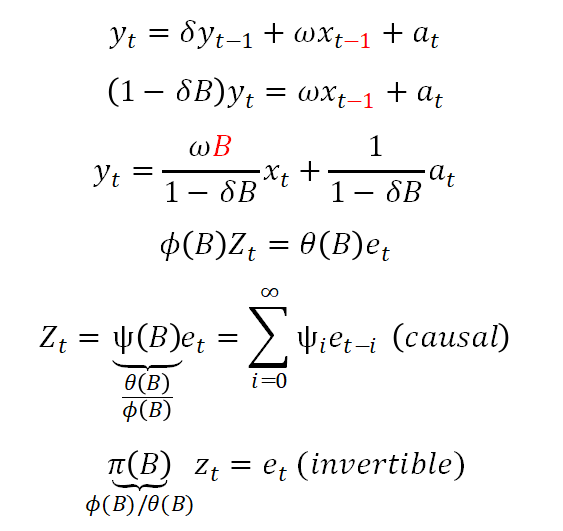
Rational distributed lag model
Koyck distributed lag model
Sizing
1. Stronger signal bigger position…
2. Standardized or normalized signals…
Assignment
Data: Stock Price ![]()
Signal/Filter: Technical indicator

Sizing: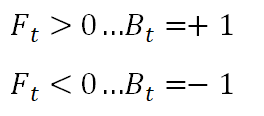
Rule return:
